Startup Metrics are the way to depict the overall health of the company. It tells how effectively a startup is operating its key business activities……
Many startups consider revenue and profits to be the most important metric.
But If only it worked. Startup operations are not JUST limited to revenue and profits. There are a whole bunch of significant metrics that a newbie founder may overlook.
Measuring these metrics in your startup business will give a focal direction to grow your company in the long-term game. It helps in creating informed decisions towards business growth based on concrete data.
Persistent tracking of the metrics indicates that your business model is viable. It acts as a solid backing while pitching to investors.
As it indicates how solid the product is and how rewarding it could be when they invest it. With these benefits of Startup Metrics- Let’s Understand the following Five Key Metrics that Every Startup Founder should track:
Financial Metric
Cash Flow
Cash flow refers to the total amount of cash along with cash equivalents present in with the business at a given time.
Positive cash flow is an indication of the amount that is getting indeed to the current cash reserves of the company. It forms an essential metric to assess the company’s flexibility, liquidity & financial assistance.
Cash Burn rate
Cash Burn rate is the rate at which the cash from the business is reducing. It’s the most critical metric as running “Out of Cash” is the topmost reason for startup failures.
Investors monitor the burn rate for tracking the speed at which the money is used & how much profits you have achieved before exhausting the funds.
Monthly Cash Burn Rate
It indicates the amount you spend every month. The formula for calculating Monthly Cash Burn Rate:
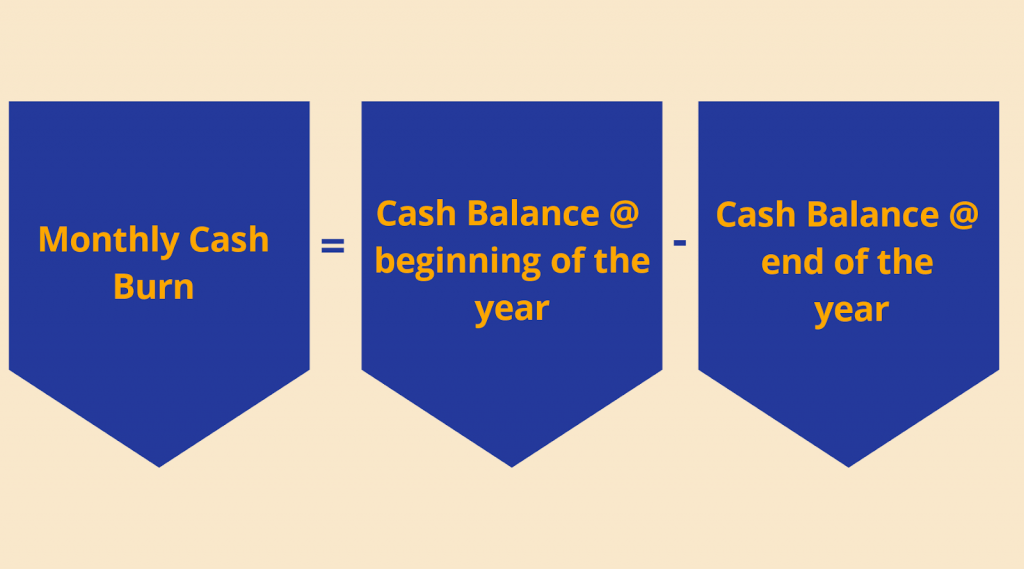
For Eg: If you have $1,00,000 on 1st January and you reach $25,000 on the 1st of October- So the burn rate is $75,000/9 or $8,333/month.
With this, let’s calculate the Gross & Net Burn Rate:
Gross Burn Rate
It includes the monthly expenses along with other cash expenses, before deducting the revenue.
Net Burn Rate
It is the actual burn rate and includes the money your company spends every month.
Cash Runway
It indicates the duration for which your company can still operate without money. It influences how long your company can survive. Cash Runway can be calculated by dividing the cash balance by your burn rate.
For Example, Your Cash balance is $2,00,000 and the monthly burn rate is $20,000. Thus you have 10 months in hand before you are out of cash.
Recurring Revenue
Revenue is the blood flow that an organization requires to operate in the business world. Mainly the revenue a company generates is through its product or services.
It highly impacts investors’ decisions as a successful product means more revenue & thus greater returns for investors.
MRR (Monthly Recurring Revenue)
It is the revenue that is generated each month. It includes only the recurring revenue each month while excluding non-recurring revenues.
ARR (Annual Recurring Revenue)
It includes the revenue that generates every year and not the one-time payments such as professional service fees.
ARPA (Annual Revenue per Account)
It includes the total revenue that a company can generate from each account or a customer. It is calculated by dividing Monthly Recurring Revenue by the total no of customers.
Gross Profit
It refers to the competence of your revenue streams to generate profits. Every company has varied choices to decide what to include and what to not include. It is calculated by deducting all the costs from the revenue.
Churn Rate
Churn rate is the rate of Customer Attrition. For instance, Unsubscribing the subscription plan for Netflix. The Churn Rate is of mainly two types- Customer Churn & Revenue Churn.
Customer Churn
It refers to the percentage rate at which the company loses customers at a given period. Consider, you have 100 customers of your product and in the past one month you have lost 5 customers. So, your Churn Rate is 5% for the month.
Revenue Churn
It refers to the percentage rate of the revenue that a company loses at a given period. Taking the above example, each customer was paying $100 for your services and as you lost 5 customers- you lose $500 for the month.
Thus your churn rate is 5%-Dividing the churned value of $500 by total revenue of $10,000.
Sales Metrics
ACV (Annual Contract Value)
Annual Contract Value is the measure of the value that a contract will bring over 12 months. A positive trend of ACV is generally the aim.
This indicates you are employing an effective sales strategy & continuously making the product better to make the customers stick to it.
MoM (Month-on-Month Growth)
MoM is a tracking metric where activities or performance of each month are tracked, analyzed, and monitored. It is measured by considering previous months’ performance.
This metric lets users track the number of visitors on websites, sales revenue, average revenue per customer, etc.
It is calculated by subtracting the previous month’s value from the current month’s value.
The outcome is further divided by the previous month’s value and multiplied by 100. Thus, the formula is-
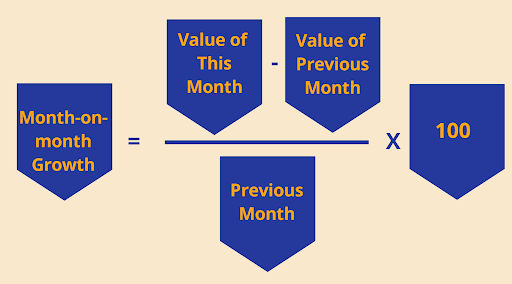
For instance, in January you sold 300 toys and in February there was a rise in sales and you sold 500 toys. Therefore, it goes like- (500-200) x 100/200= 66.67%.
Thus, your month-on-month growth for February month is 66.67%.
Gross Margin
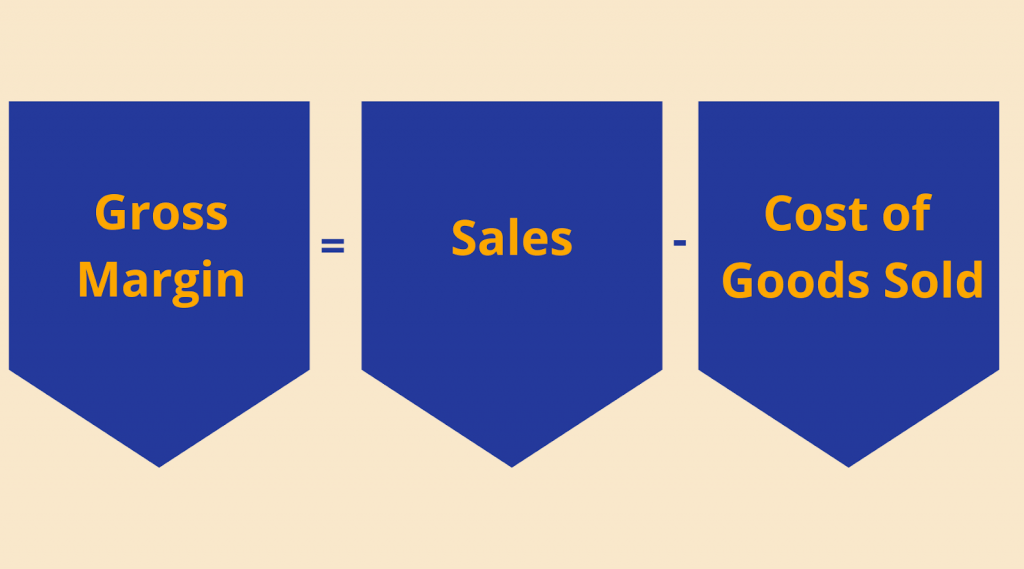
Gross Margin is the company’s revenue from net sales after deducting the costs of goods sold(COGS). It is the amount that a company can retain after incurring all the costs for the production of goods and the services they offer.
The higher retain of gross margin indicates more retain of capital for each sale the company makes. This amount can be further used by companies for satisfying their debt obligations.
The formula for Gross Margin is- Gross Margin=Net Sales−COGS, where COGS is the Cost of goods sold.
Customer Success Startup Metrics
NPS (Net Promoter Score)
Net Promoter Score is a measurement of customer loyalty and satisfaction. A high net promoter scale means you have a healthy relationship with your customers who trust your brand and will boost your word of mouth.
It is calculated by asking customer-relevant questions on a scale of 1-10. This data will help in business growth by improving services, support better customer satisfaction.
CCR (Customer Concentration Risk)
Customer concentration refers to the distribution of the total revenue among the customers. If any customers hold 10% or more than it of your revenue or your largest 5 customers hold 25% or more than it of your revenue- It is termed as high concentration risk.
The high concentration risk indicates the level of difficulty to turn away business from larger customers. Check out this calculator for determining the CCR.
Marketing Operation Metrics
Customer Acquisition Cost (CAC)
Customer Acquisition Cost is the cost a company incurs to acquire a single customer. Generally, the acquisition cost should be lower than the revenue your customers will bring to your company.
CAC is calculated by taking all monthly and sales expenses and dividing them by the total of customers.
LTV (Customer Lifetime Value)
It is about how much your customers will make you earn as long as they are connected to your product. This can be done by determining how long each customer stays with you. It could be 3 months or even 12 months.
Then Multiply this duration figure with the expected monthly revenue and you get LTV. For startups, LTV should be greater than CAC. A higher CAC means your startup is near an end.
Direct, Organic & Paid Traffic
With digitization, this metric has become an important one. It is to monitor the source of your audience.
Are they coming through a blog? Or did they enter your company URL? Or did they see your advertisement? Thus, monitoring the sources of your viewers.
Active Users
It is to track the daily users that get on your website. The best way is to track and monitor the user on a daily and monthly basis.
It includes those who are actively engaging with your product and service or the content you provide. This helps to understand what’s working best that drives active users to stay connected with your website.
Startup Metrics for Pirates (AARRR)
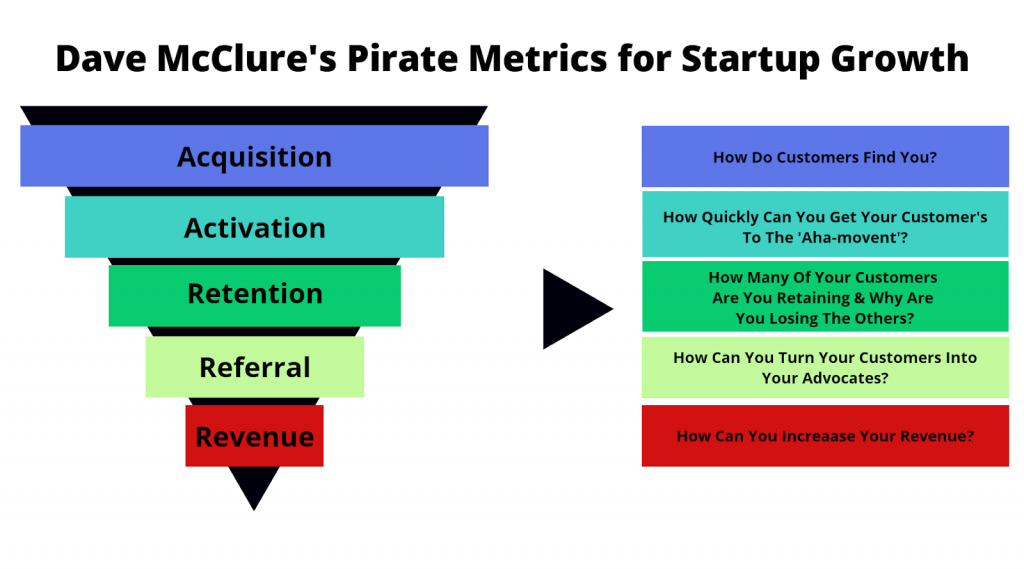
The term Pirate Metrics for startups is coined by Dave McClure in the year 2007. It’s a quick and handy metric to track the customer lifecycle at each important stage.
Dave calls this a 5-Step Framework for the growth of your business.
This Pirate Metrics is also termed as AARRR- The acronym stands for Acquisition, Activation, Retention, Referral, and Revenue. The wide acceptance of this framework is because of its simplicity and actionable metric for company growth.
Acquisition
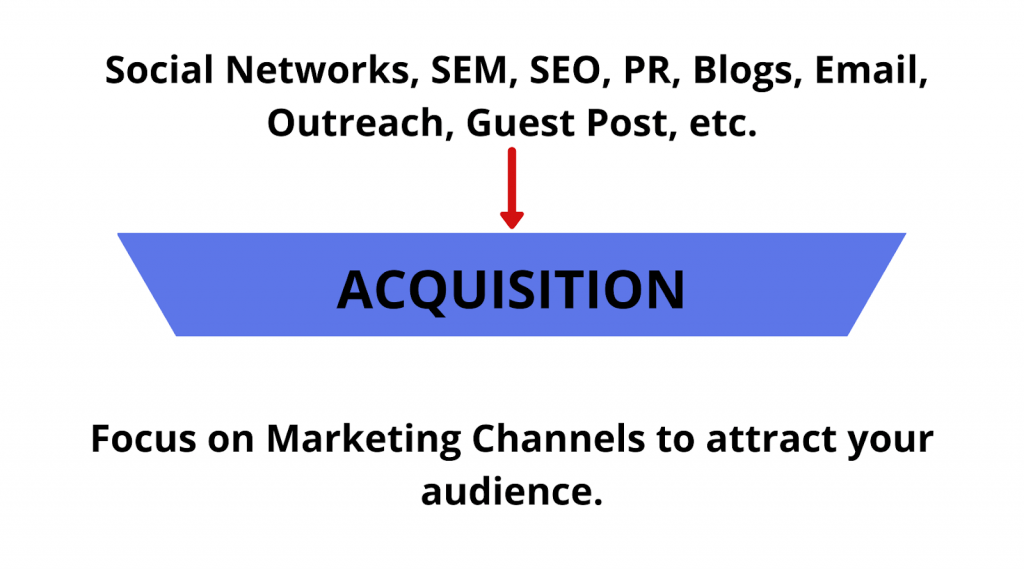
This is how someone discovers your business. It is the first meet between your brand and your potential customers.
Under this comes the basic metric, to acquire the new customers- website visits, page views, time on page, page per session, percentage of new and returning metrics, etc.
For eg: The app Postable lets users write their wedding invitations & thank-you notes through custom-made postcards designed by indie artists and mails them.
Activation
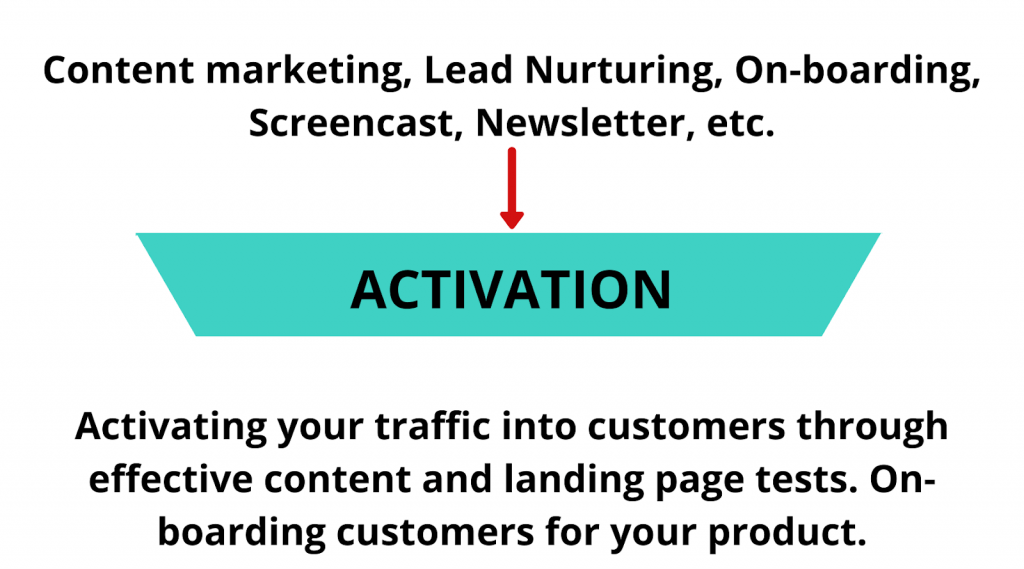
At this stage, your website visitors turn into customers. It’s important to closely monitor your new leads and map out the customer journey.
Each step in the journey counts big. Thus, figuring out what triggered them to buy your product or avail of your services.
For eg: Apple understood the problem of photographers’ low-quality images in low light. They appealed to them to click photos between sunset and sunlight through their newly released iPhone 7. Thus demonstrating its low-light capabilities.
Retention
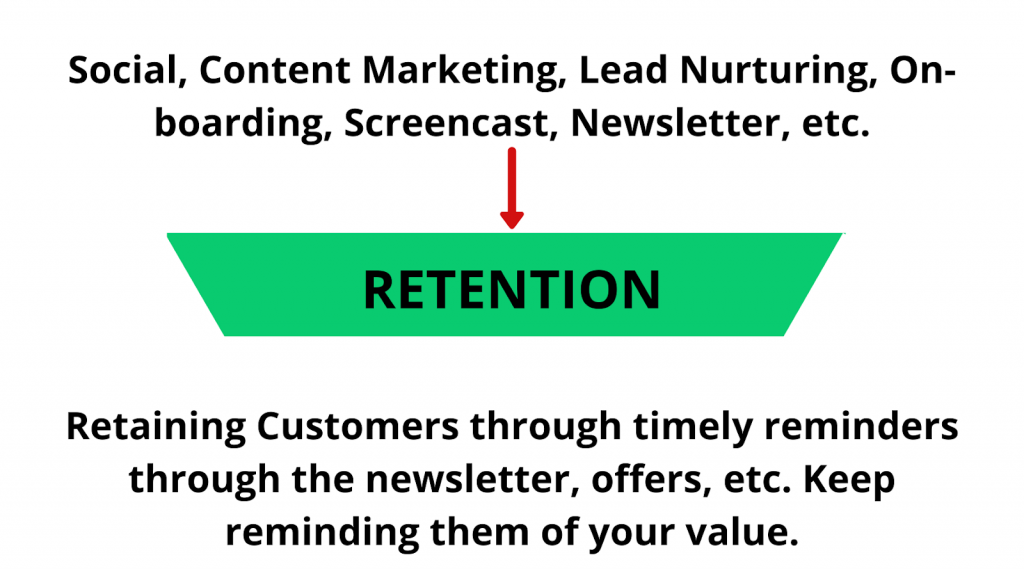
As Alex Schulz says, “Retention is the single most important thing for growth”.
The cost of acquiring a new customer is relatively larger than retaining current customers.
Retention means people are consistent with your product use. This indicates you have achieved a level of product-to-market fit and can thrive in the market.
Whereas if your churn rate gets higher, then you are losing your customers at a much greater cost than acquiring the new one.
For eg: Amazon examined their customer needs and offered a subscription-based service – “Prime” that ensures faster delivery to users. Thus, retaining them by swiftly fulfilling their needs.
Referral
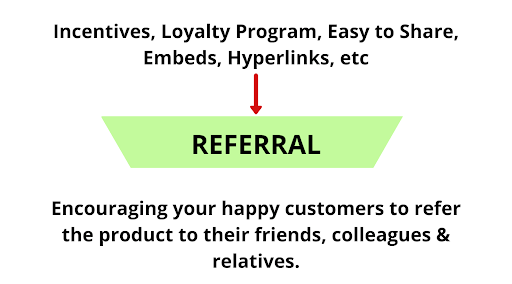
Your brand will boom when one customer recommends your product to other customers. This chain of referrals gives strength to your company which a paid acquisition may lack.
Your customers not only just remain customers, but they also become your advocates who talk about your products and refer them to others.
One of the great examples has Dropbox gained 2.8 million users just through direct referrals. Isn’t that amazing?
Revenue
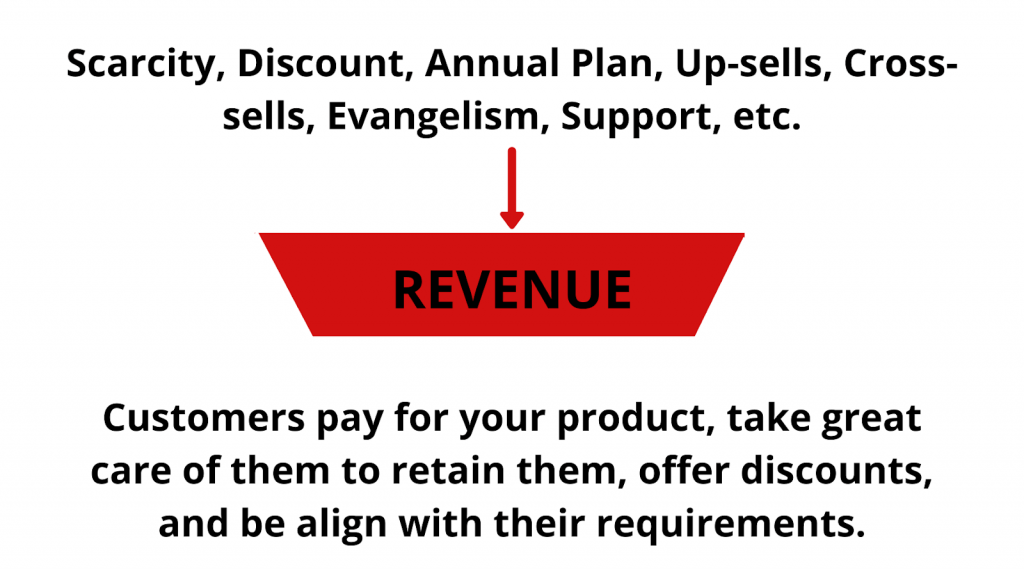
If you are tracking your startup based on this metric then definitely revenue is generating smoothly in your organization.
The best way to generate more revenue is by decreasing Customer Acquisition Cost (CAC) and leveling up your Customer Lifetime Value(CLV).
Thus nurturing your customer needs and the requirement to retain them for a longer period. Let’s take the example of the Game Developer Valve that once ran a discount of up to 75% that earned them a 293% increase in revenue.
Startup Metrics Dashboard
Metrics are all about numbers and data. Tracking these data firmly requires some extreme efforts. With key performance data in hand, one can keep an eye on the intricacies of startup operations.
To be successful is to grow consistently, and to grow is to make a persistent improvement to current performance.
A Startup Metric Dashboard will let you understand which spots you are growing and where you are lacking. It gives an honest and broad look into your business.
Some of the ideal brands for startup dashboards are Cyfe, Klipfolio, Visible, etc.
Take Away
Startup Metrics are formed for measuring this from that, to measure yesterdays’ achievements with todays’ achievements.
They give an open look into where we are remaining behind- it shows the gap that needs to be filled up to gain sales, earn revenue, increase profits, and grow in the market.
It assures that our decisions are not on loose air. Thus measuring them is to base your decisions based on real data and accelerates the growth in the right direction.


