Retention is the stability that a business needs. And achieving the feat of a success-defining retention curve is every founder’s dream. As Patrick Demoucelle asserts, a 5% increase in retention brings a huge surge in company value by 75%.
It badly hurts when a customer you worked hard on to acquire, unsubscribe your service. It pierces the heart when your most loyal customers drop you to go to your competitors. Thus, you failed to retain your customers.
Retention is when people like your product and choose to return, for re-experiencing your product. Customers coming AGAIN AGAIN & AGAIN is a sign of success. It’s a great thing for your business growth.
When Inc.com claimed customer retention is the major factor that contributes to business rate – Does that mean your first-ever customer should be with you forever?
NO !!!
Just as nothing lasts forever – even your first customers will leave the list one day. A small amount of Churn is normal. But spending big dollars to acquire new customers with the least focus on retaining the existing ones will drown your business eventually.
A company should aim for 80% retention and 20% acquisition and not vice-versa. It’s a holy grail formula that pays in big numbers be it in terms of profit, revenue, or growth. Every company experiences following retention curves in their customer-product relationship journey. So let’s see what these curves are-
The Three Retention Curves
A good rate of retention implies you have achieved product-market fit and your product is healthy enough to satisfy customers. But one size doesn’t fit all. Because no two products, customer groups, and even methodologies are alike.
A content streaming platform and a song streaming app have poles apart acquisition strategies. Because not everyone who has Netflix has a Spotify subscription.
Every service or product will have a different interpretation of retention curves. An e-commerce company will define retention when a customer opens the app, browse products, makes a purchase, and revisits to make more purchases. Whereas for a SaaS company it will be when customers renew their subscriptions or contracts on a timely basis.
MixPanel’s Report revealed – the retention rate for most of the industries is below 20 percent for an average of eight weeks. Whereas for the media or finance industry, a retention rate of 25% for eight weeks is an ideal benchmark. And for SaaS & E-commerce industries it is 35%.
Measuring retention is based on three factors: Events/Actions, Time Frames, and the Number of actions in the timeframe.
Events or actions are any activity that a user performs on the platform such as sign-ups, purchases, shares, or simply opening it. The time frame is the period of retention – it can be one day, one week, or monthly tracking. Next is to calculate the limit of action to be taken in a specific period.
In general, there are three types of Retention curves:
1) Declining Curve
2) Flattening Curve
3) Smiling Curve
Declining Retention Curve:
This implies a continual decline in the number of customers after acquisition. The graph shows a downward trend in customer retention which eventually reaches zero. This also indicates the product has failed in the market.
Flattening Retention Curve
This is the ideal curve an entrepreneur should aim for. It asserts that users loved the first experience with your product and thus they are returning.
The flattening of the retention curve at higher levels signifies higher long-term retention and good health of the product.
Smiling Retention Curve
This is achieved when a product is extraordinary and justifies the product-market fitness. The downward curve goes up when the product improves & develops new value propositions.
But here is the catch – No matter how good the product is, how disruptive it can be. Every product will eventually make it to the bottom due to cut-throat market competition.
So now you are familiar with types of retention curves. But there is one more terminology that shouldn’t be missed by any founder and it is Rolling Retention.
What is Rolling Retention?
Rolling Retention is like a brother of retention or classic retention. It is the number of users who returned to the app on a particular day or on any day after that particular day. It is calculated as,
 Let’s simplify this, considering you got 20 users on the first day of the month. On the 2nd day of the month 11 users. And on the 7th only one unique user returned. Whereas on the 9th you got 8 unique users, 6 unique users on the 12th, and 3 unique users on the 17th day.
So the rolling retention for Day 7 is 18/20 i.e 90%. As there are 18 users(1+8+6+3) on and after Day 7 whereas for Day 14 it is 3/20 i.e 15% because there are only 3 users after Day 14.
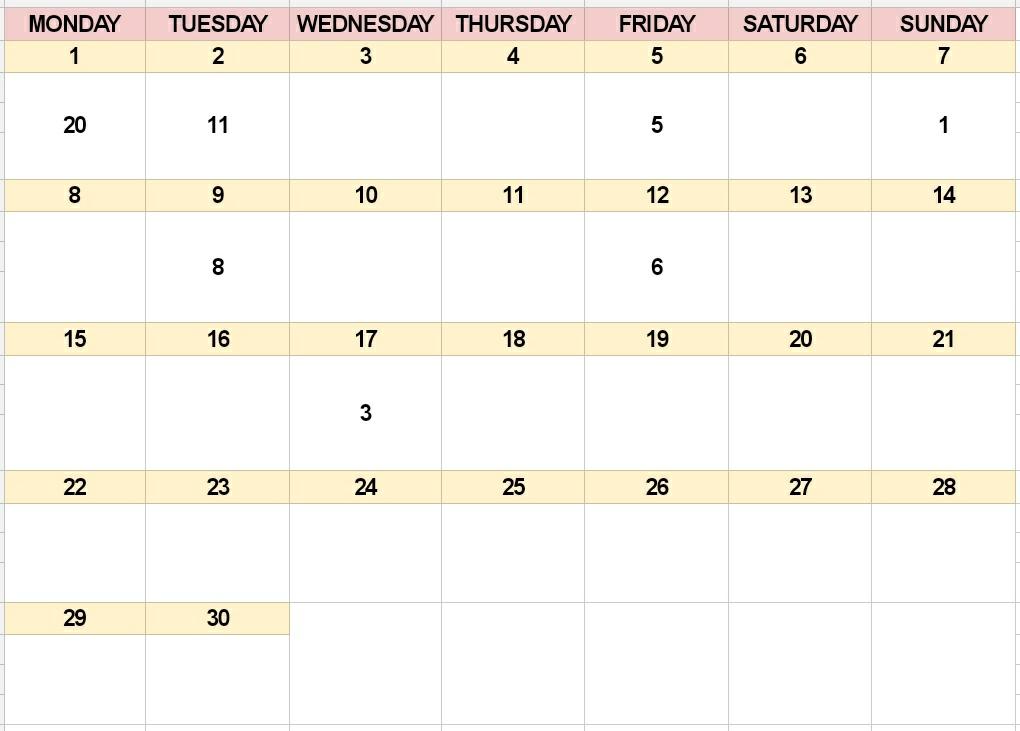 As in classic retention, the last day of the period does not know how many customers churned on a specific day from start to end of the period. Whereas rolling retention considers users not only of a specific day but also the users who opened it later after the particular day.
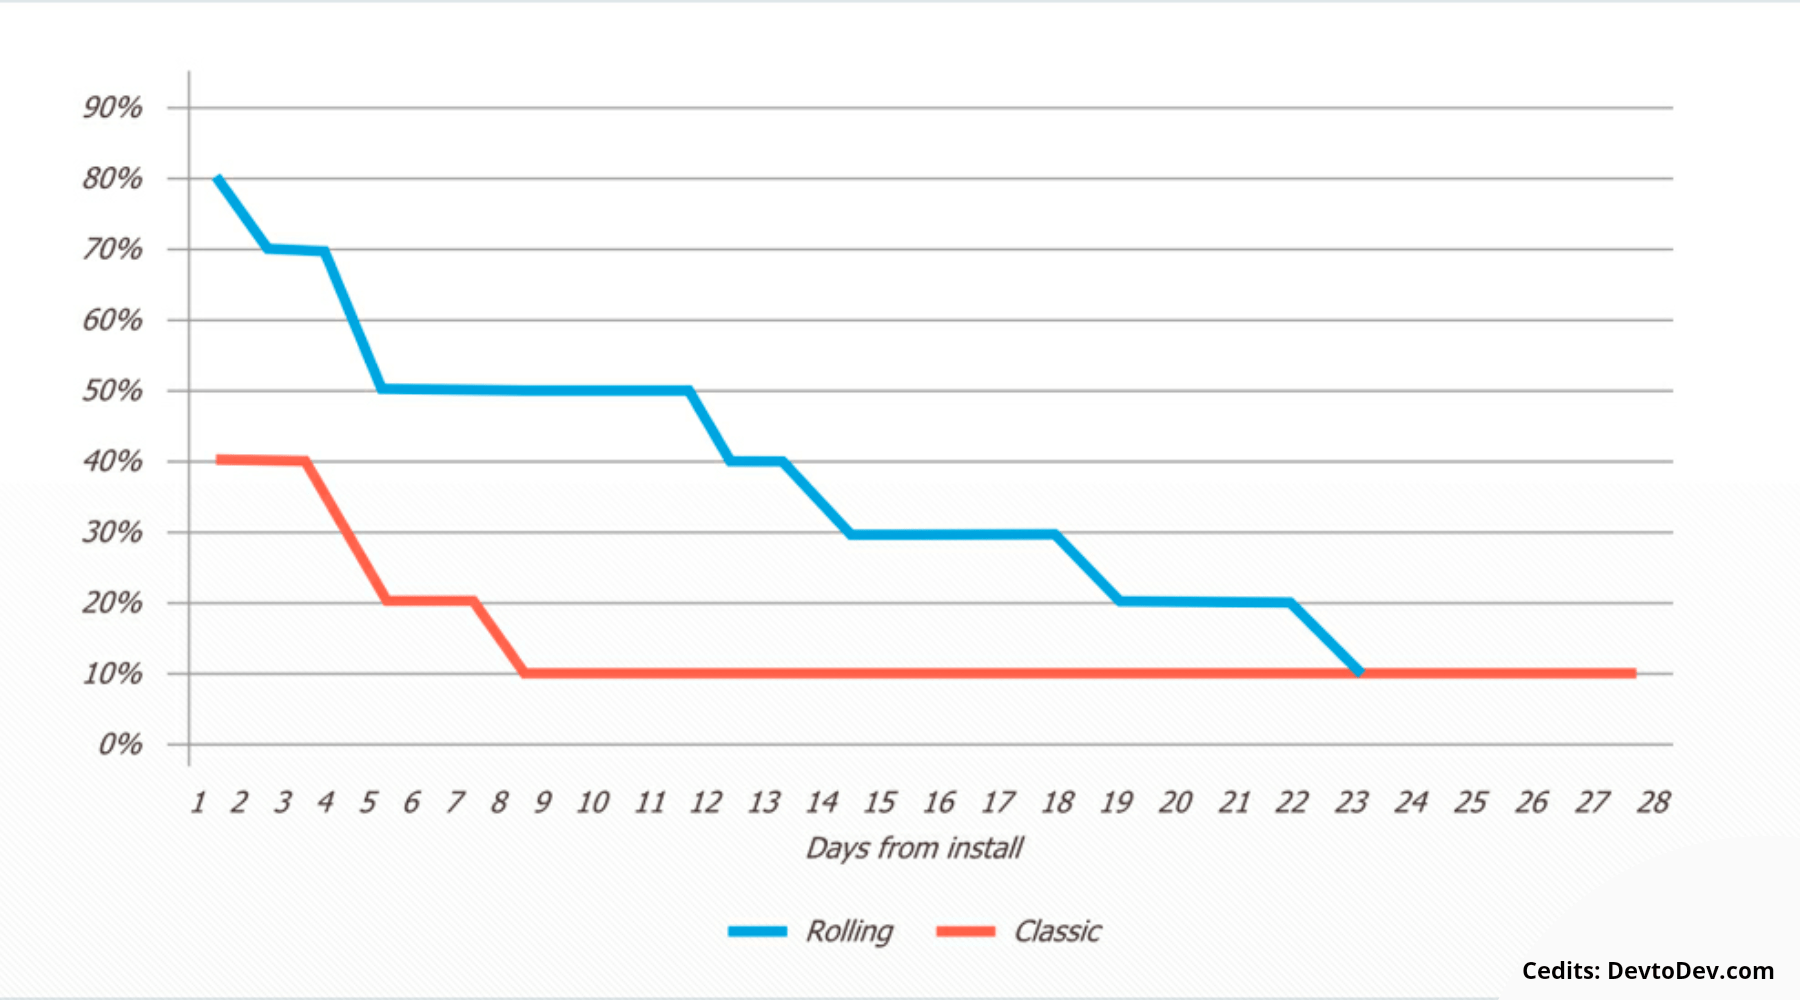
Rolling Retention is always higher and smoother than classic retention. It gives a better and fuller picture of user accounts. This metric is more appropriate for those applications that are not made to be opened daily For eg: a gaming app, a rent payment app, a flight booking app, etc.
But, the calculation of Rolling Retention is complex and requires daily recounting of users. It provides profound insights into the lifetime value and churn of customers. Thus, making it a great tool to make informed decisions. Now let’s understand how to analyze and calculate retention cohorts.
Cohort Retention Calculation & Analysis:
Cohorts are the “Group of People” that have a common feature. For example, in the first week of November, you got 1000 sales. That’s a Cohort month. Millennials are a Cohort. Gen Z is a cohort. Monthly signups, weekly subscriptions are cohorts, weekly sales, weekly profits and many more are all cohorts.
So when we monitor whether our customers belong to Gen Z or Millenials, whether our February sales are more than January sales, etc. It is Cohort Analysis. It examines the retention of cohorts based on actions (signups, subscription renewal, etc) along with a time frame (daily, weekly, monthly, yearly, etc). Cohort Retention is calculated by

Cohort Analysis is an effective tool for reducing Churn and improving retention. It gives deeper insight into the trends of retention.
A product manager should observe and isolate the causes of the downward trend. And in case of upward trend should isolate what features and marketing campaigns made it happen to capitalize on the changing point. The task of analyzing cohorts is tedious. But the tools like Mixpanel, Amplitude, Kissmetrics, etc are worth trying for simplifying the process. Google Analytics and Google Sheets are also one of them.
3 Easy Ways of Creating & Analyzing User Retention Curve
Apart from various Data management software, there are few inexpensive ways to create and analyze retention graphs or curves. So here comes the four different approaches to effectively create and analyze retention curves.
#1 Retention Curve Using Google Analytics:
Pete Spano has simplified the process of generating retention graphs and performing cohort analysis for actionable insights through Google Analytics. So, to create a retention curve or retention graph one should have cohorts at the right place. So let’s start with Cohort Analysis through Google Analytics
1) At first, the Google Analytics dashboard’s two tabs – Audience & Cohort Analysis are the key role players.
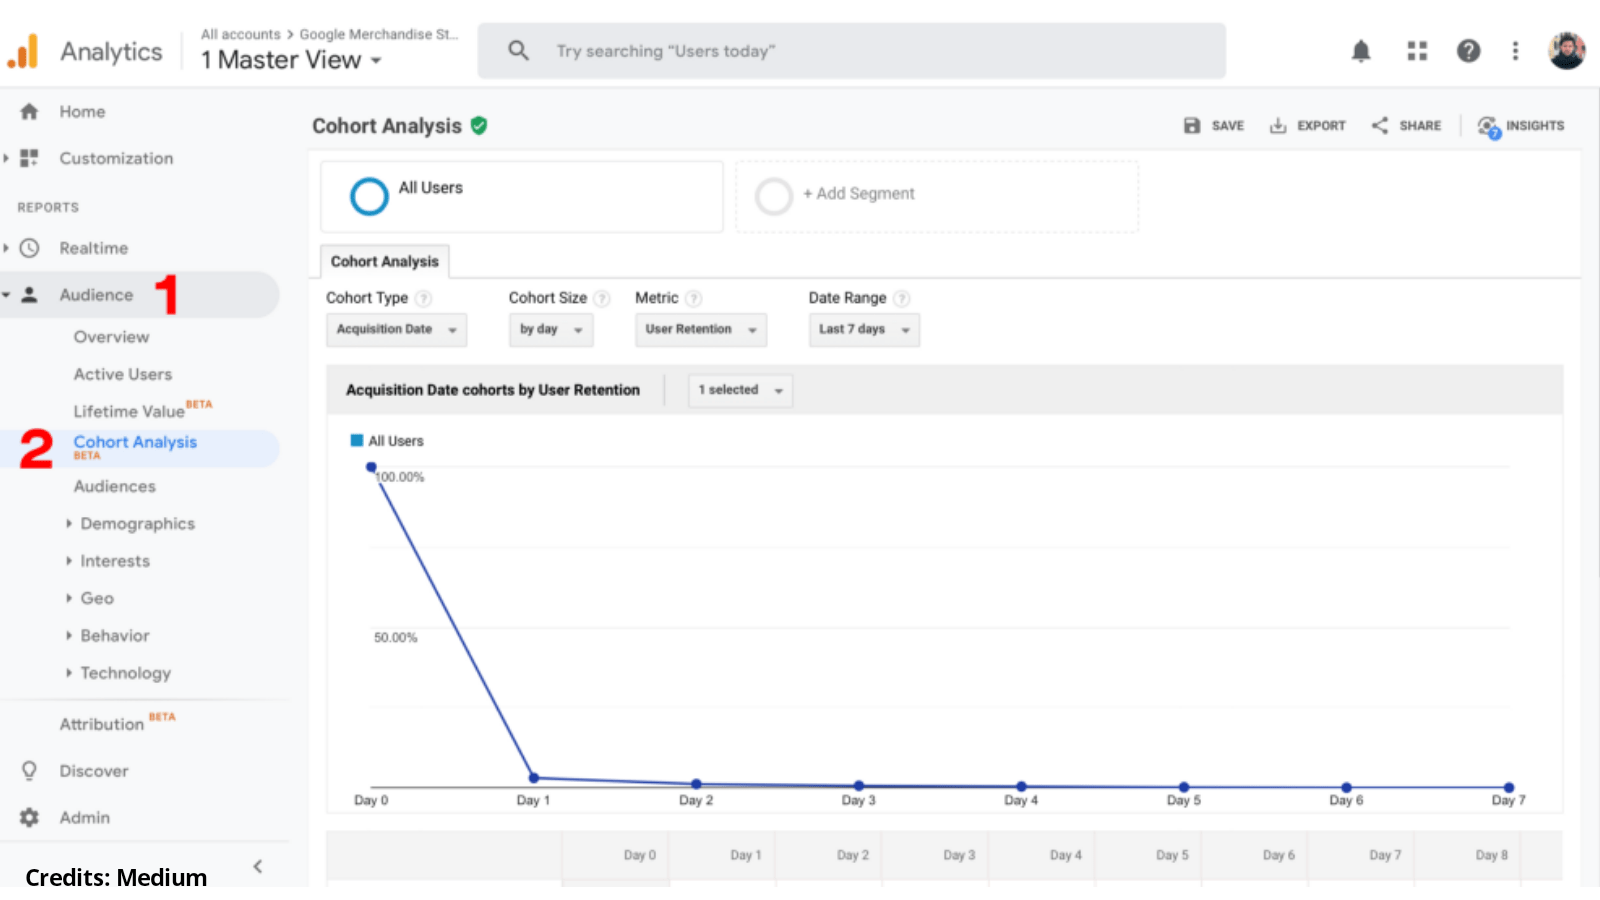
2) Under the Cohort Analysis tab, these are the following key properties – Cohort Type, Cohort size, Metric, & Date Range.
3) Follow these settings for each property – Cohort Type:-User Acquisition, Cohort size:- Week, Metric:-Retention, & Date Range:- 9 weeks.
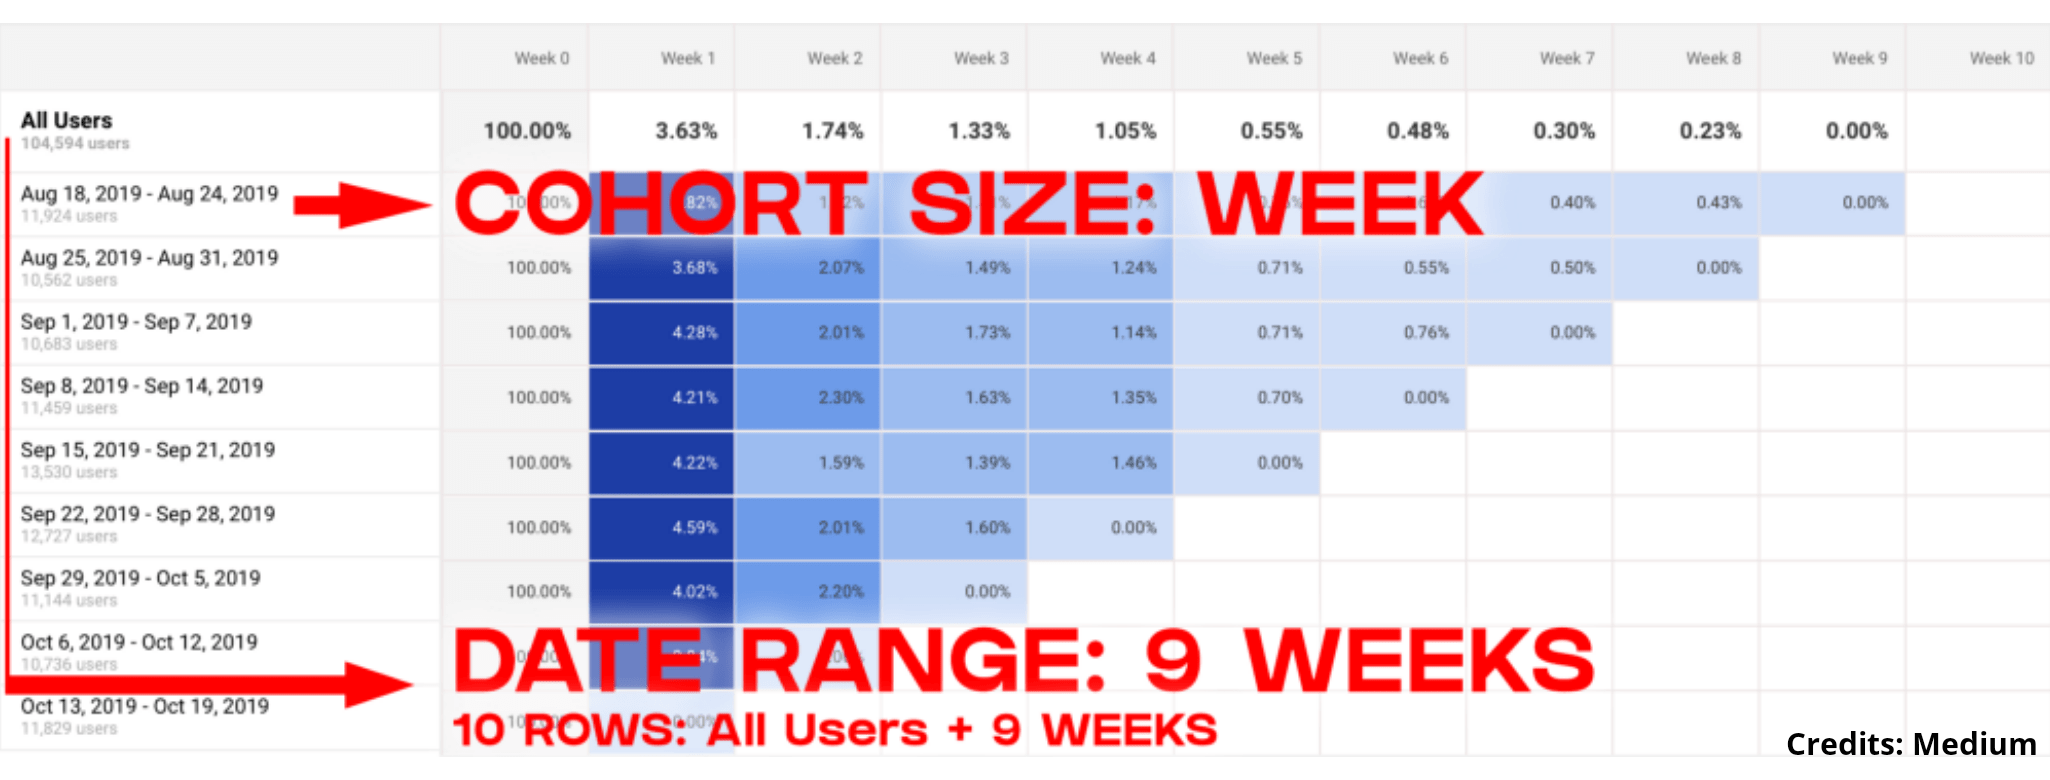
4) Google Analytics is a robust tool to drive deep insights. However, these above settings are based on the requirement of performing retention cohort analysis.
5) Here, each row is a weekly based cohort as we have selected “Last 9 weeks”
6) The first row of the Chart “All Users” is the average of all cohorts. With this, a default retention graph is made as below.
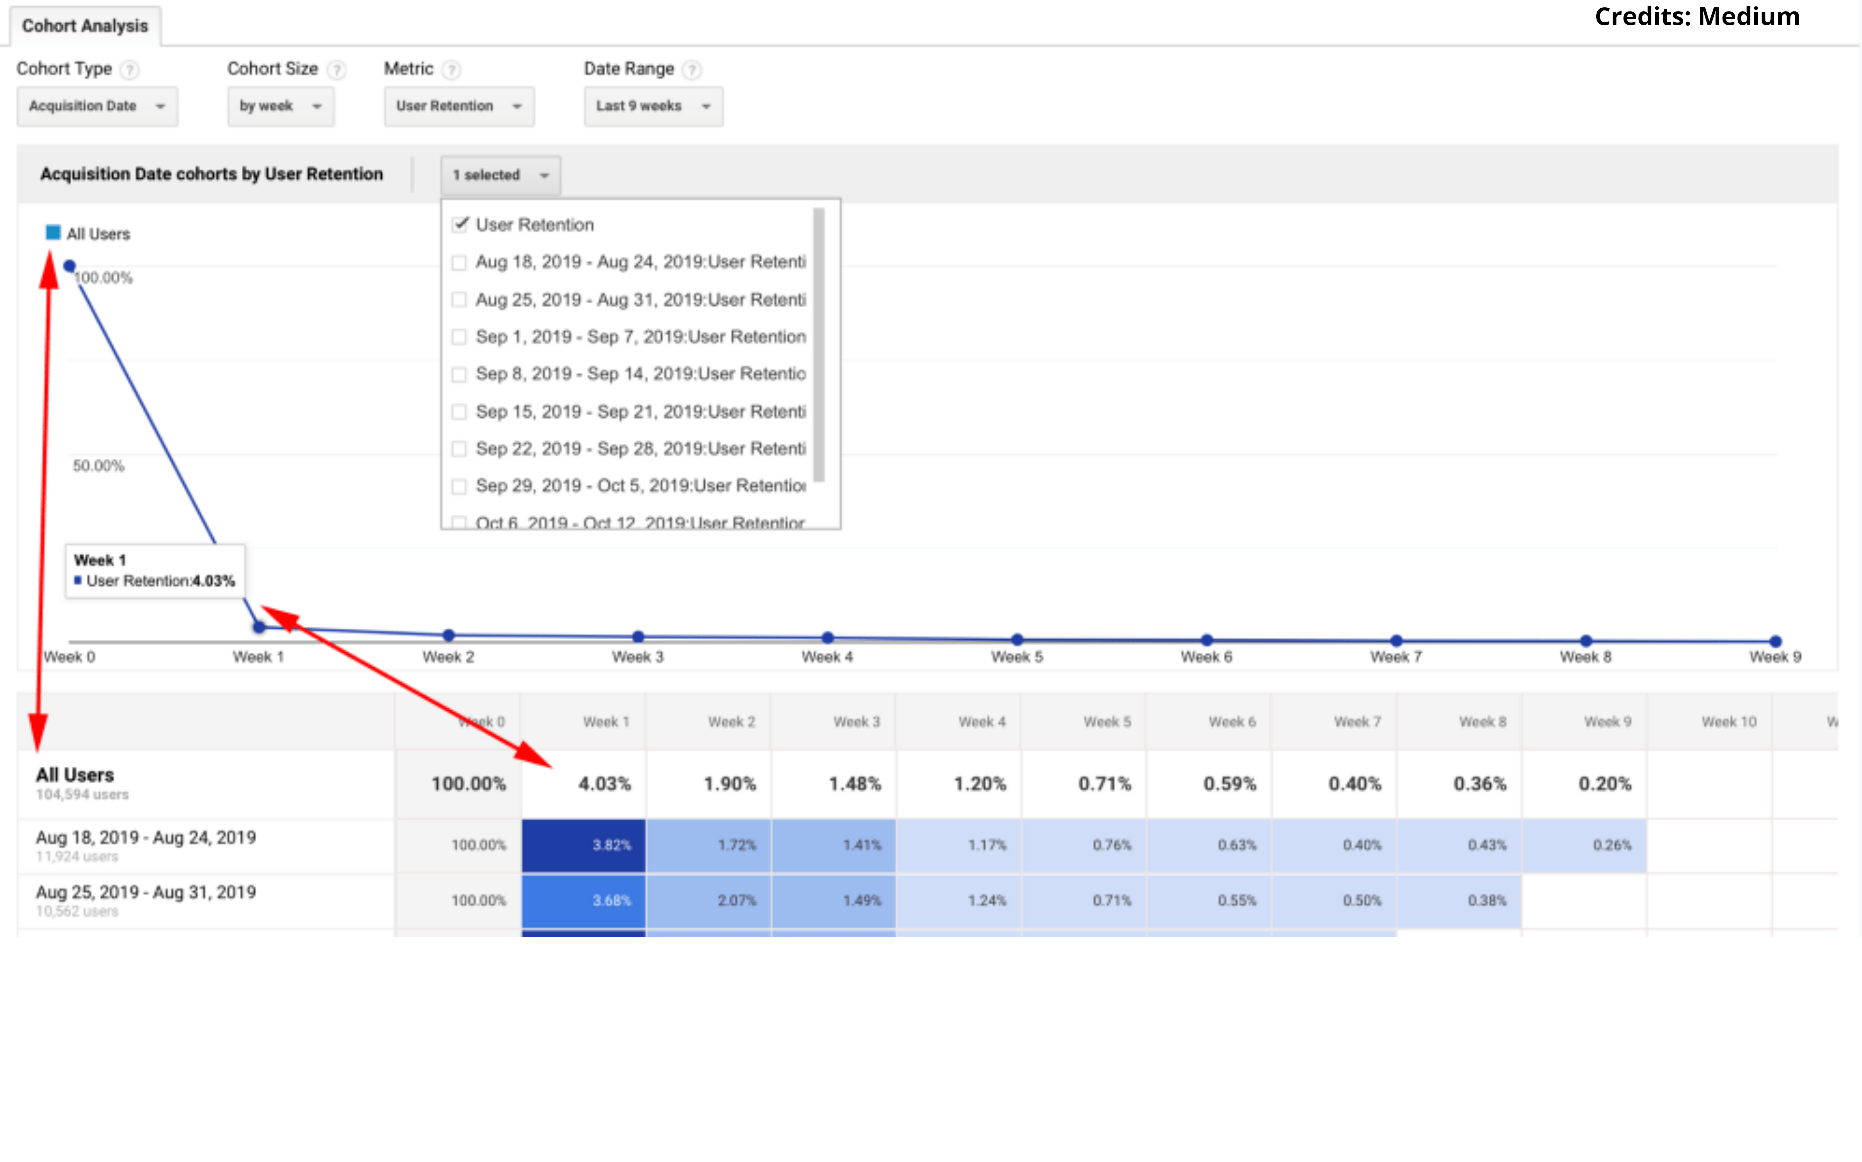
7) The graphs can also be filtered based on the weekly cohorts you choose.
8) It can be observed from the charts that out of all the acquired users only 4.03% of them returned whereas this figure reached less than 0.50% in week 9.
So here is a quick step-by-step process for understanding Cohort Analysis. Apart from this, Google sheets can also be used as a tool for Cohort analysis. Check out this quick 3-min Cohort analysis process by Daisy Deng.
#2 Retention Curve Using SQL:
To begin with, Let’s assume you’ve 1000 customers for January 2016. Let’s first create a pool of customers by considering Customer Id, Month & Year. Here goes the first query:
Now, the second query will be based on customers behavior like how many returned and how many got churned during the period:

Based on 1000 customers, this is the resulting table you’ll get :
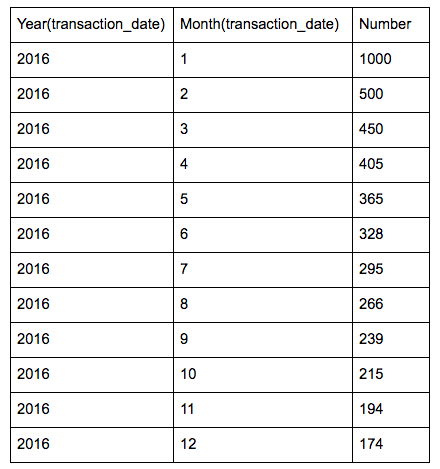
After this first step let’s create an iterative model that tracks each user’s visits based on months.

This is the output you’ll get:
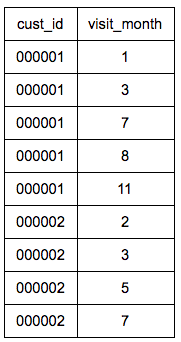
Now, let’s organize this to identify the time lapse between each visit for each person and each month.

And to calculate the time gap between visits:

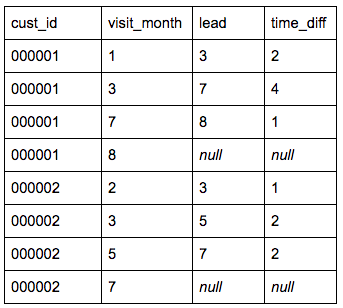
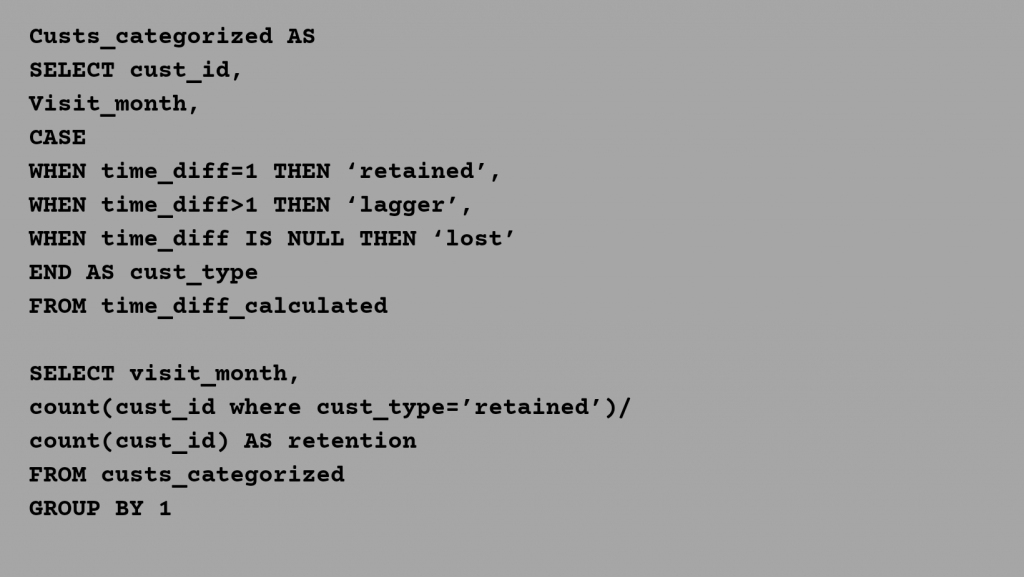
The next step is to count the number of customers that are retained, lagged and lost. And the last step will be to calculate the number of customers that newly visited in a month and also returned in the next month:
This is the resulting retention graph you’ll get
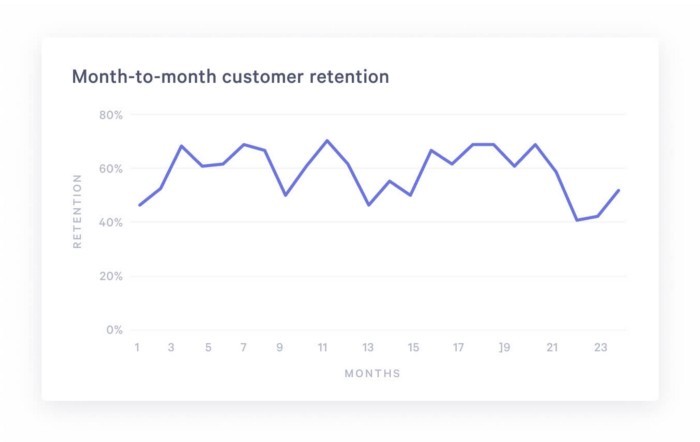
Original Credits: Statsbot
#3 Retention Curve Using Excel Sheets:
The excel sheet approach is the easiest of all the two. So to begin with let’s consider, you got the following cohort sizes and weekly count of customer retention.

Select all the table data. Click “Insert > Chart”. In Chart Editor, Go to “Chart types” & Select “Smooth line Chart design” in Lines. Select Checkbox “Switch rows / columns”. Click “Customization” to edit the title. This is the output that you’ll get:
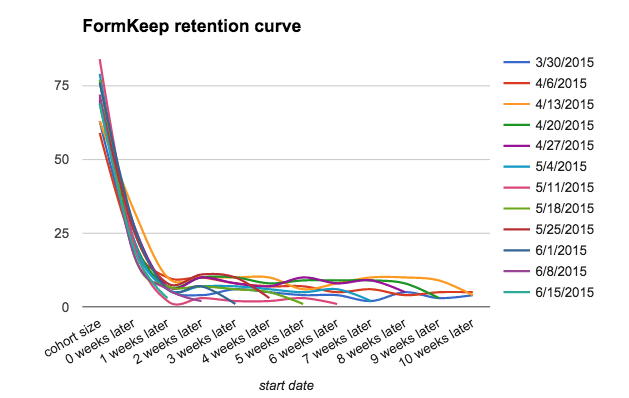
To make this more effective visually, we’ll make a small design improvement. Select each time series and pick a shade from the same column. Going from lightest shade for oldest series to darkest shade for newest series. This is what you’ll see:
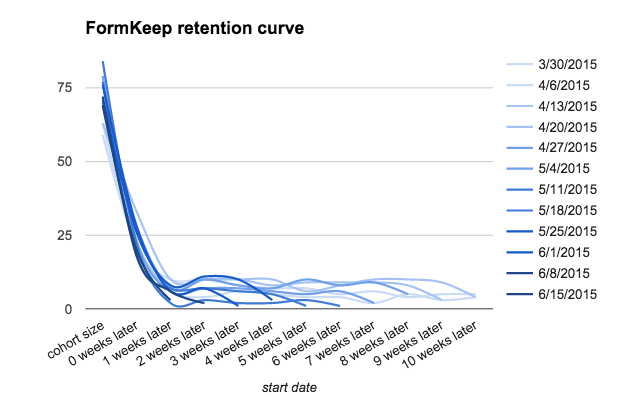
Original Credits: ThoughtBot
Ain’t that the easiest way to create a retention graph on Excel. After all the analysis of cohorts, & retention graphs, a product manager has to figure out why the figures dropped down? Or why did the customers leave?
Top 5 Reasons for Customer Leaving
After all the analysis of cohorts, a product manager has to figure out why the figures dropped down? Why the retention curve took an unexpected turn? Or why did the customers leave? So here go the top 5 reasons for customers withdrawing from your product or service.
1) Poor Customer Experience
Customer Experience is how you make your customers feel when they visit your website or store. Imagine a storekeeper being rude to you for not having money change or Imagine entering a store where tissues are placed on napkins shelf and napkins are placed on towel shelves. Would you go there again?
A customer will always choose a store where everything is at the right place or that provides a seamless customer experience. A great customer experience has these three main things – Easy to use product or service, good value, and a good buying experience.
2) Lack of Good Quality
Your product or service failed to keep up with your customer expectations. Your products or services failed to recognize the customer’s needs. Monitor the negative feedback to find out the shortcomings. Upgrade your product and improve the value it aims to provide.
3) Weak Customer Service Strategy
Poor Customer service will make your customers turn their back. There is friction in communication between you and your customers. No matter how perfect you think your product, service, or process is – there will always be customers that will pause or may get confused while understanding it.
As you are an expert, they will naturally expect guidance from the company to help them out. A good customer service strategy smoothes out friction and brings you closer to your customers.
4) Absence of WOW Factor
There are many similar products or services in the market. But the one with the WoW factor has greater capability to withstand the competition. That’s where the competition begins.
There are many fishes in the market – But why choose your Product or Service? The absence of the WoW factor will contribute to a substandard value proposition that could also lead to a market failure.
5) Failed to Deliver Promises.
You got a 24 hrs MAC Lipstick and it faded in 2 hours. Your long-lasting Chanel perfume betrayed you at the next hour. Would you buy a product that failed to keep up with its promises?
Failing to deliver promises is an easy opportunity for your competitors to woo your customers to leave your product or services.
Top 5 Tactics to Boost Customer Retention
1) Increasing Engagement with retained users
Be with your Customers. Engage with them through blogs, newsletters, email marketing, etc. It has three user engagement metrics for which every company should keep their eye on – DAU, WAU & MAU.
- – DAU: It calculates the daily unique active users who completed an action on each day.
- – WAU: It calculates the weekly unique active users who completed action for each week.
- – MAU: It calculates the monthly unique active users who completed action for each month.
Based on the different services and experiences you offer, determine the actions that will be accounted for as an “active” or “engaging“ user.
Instead of focusing on the total number of users under each metric, one should prioritize calculating actions taken by users for any period. Thus, giving better inputs in finding points to increase user engagement.
If the engagement suddenly falls, be quick enough to pivot the strategy to regain traction and engagement.
2) Increasing the Contact points
Nir Eyal’s bestseller book “Hooked: How to Build Habit-Forming Products” has cleverly illustrated the external triggers to nudge the users when they are away from you.
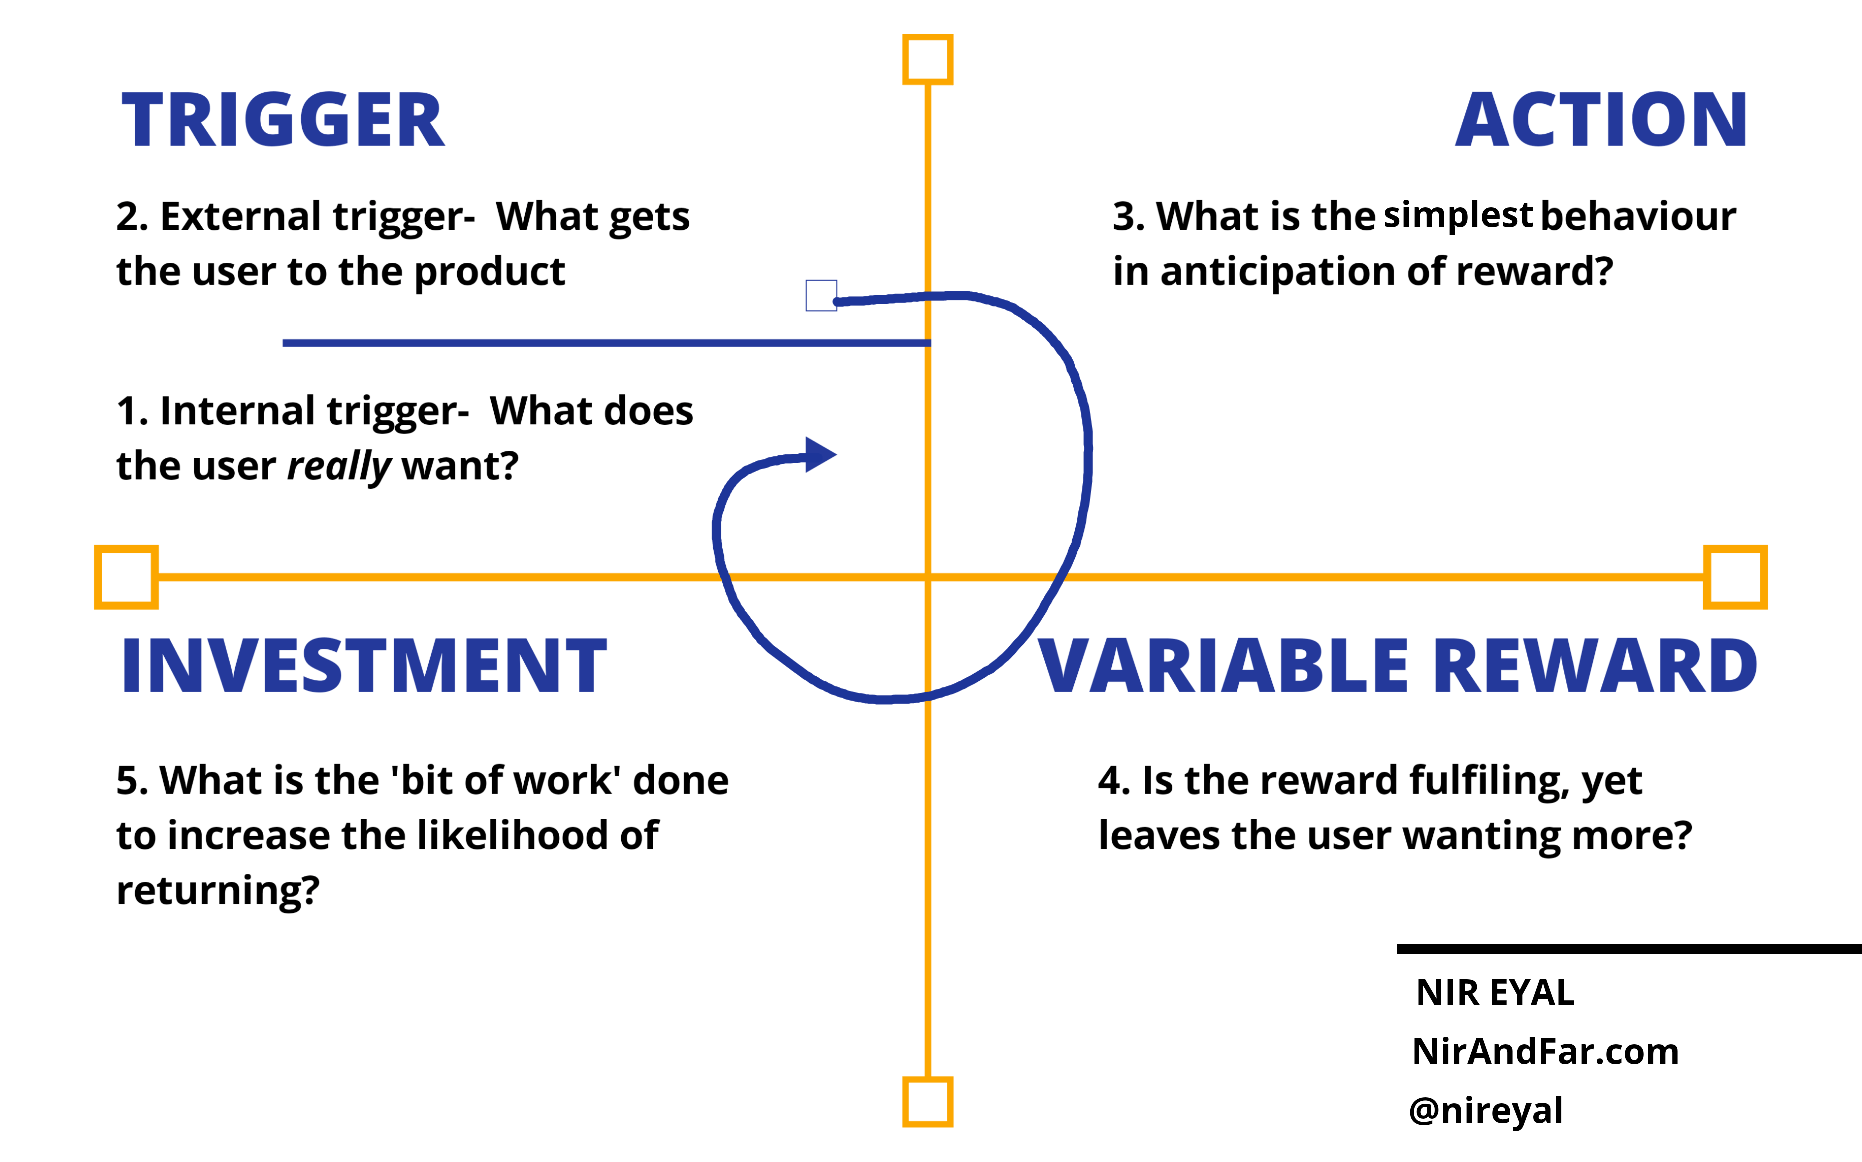
The hook model has 4 steps:
Triggers: Triggers tell the next step in the process. It comes in the form of external and internal triggers.
Actions: It is the activity or the habitual behavior performed with zero conscious thoughts.
Rewards: It is the psychological relief that one gets after performing a certain behavior.
Investments: An activity that users perform to increase the likelihood of returning to the product.
This model is designed to establish a connection between users’ problems with the product maker’s solution.
3) Solve the Product Problems
A perfect product may not always bring the desired success. Only a customer knows what it wants from the product. Any confusion at any level of the process is an indication of poor user experience. Examine the hurdles and look for what your product lacks and customer needs.
4) Monitor your Price
Your Price should be at a level with competitor pricing. If your Price is the reason for customers leaving the product or service so be ready to modify your Pricing Strategy.
Leverage A/B testing to figure out what works and reform your prices based on customer feedback.
5) Improve Customer Experience
Customer Experience is about creating a memorable journey for your customers. It is the first experience that a user will have when they visit your website. It is about giving customers what they want even before they need it. A good customer experience will urge them to come back to your website again and again.
To Wrap:
Retention is not about customers making daily purchases. Instead, it’s wherever a customer needs your type of service or product you are their first choice. Figuring out the reasons that Offboards a customer can be guiding insight to plan out future strategies.
It gives a clear view of how your products or services grow in the market. Build a WOW factor for your services that hooks the customer to return to it Again & Again. This will not only improve your product but also benefit you in getting the desired retention curve trend.


